Financial Data
TECHNO RYOWA LTD. and Consolidated Subsidiaries Financial Data
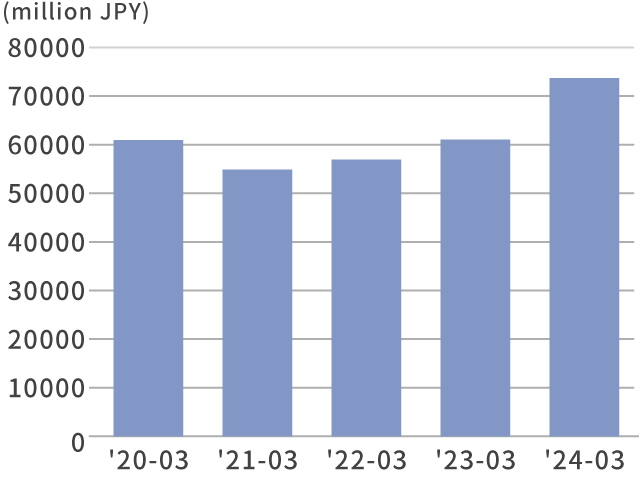
Revenues
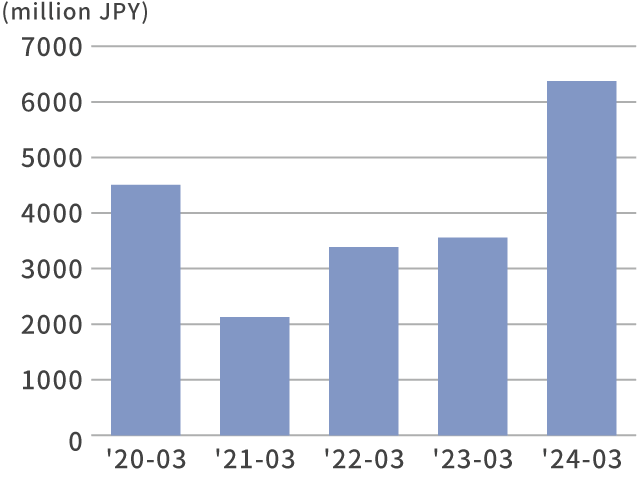
Ordinary Income
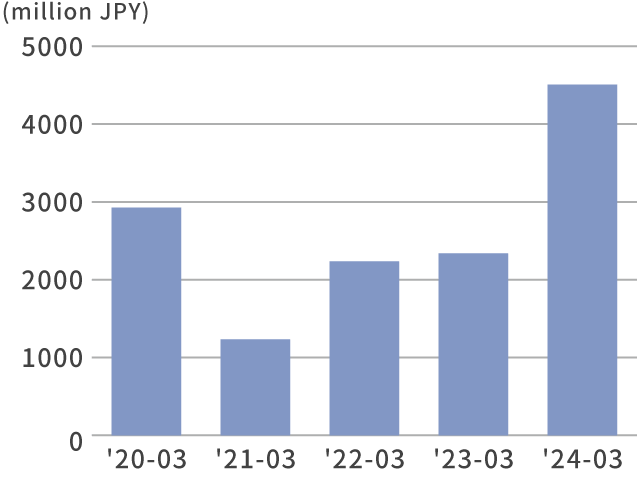
Net Income Attributable
to Owners of The Parent
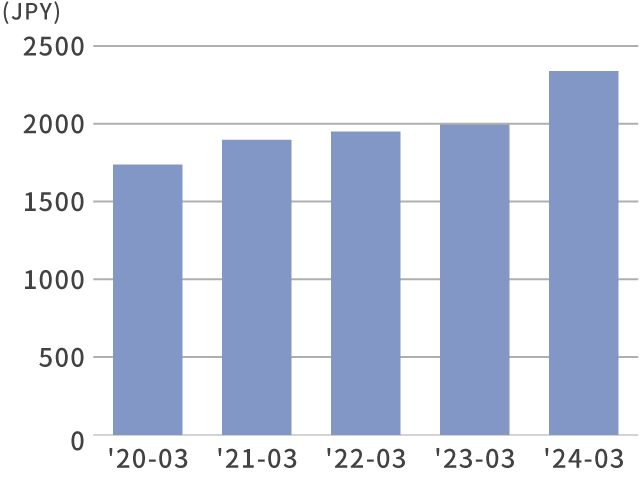
Book Value per Share
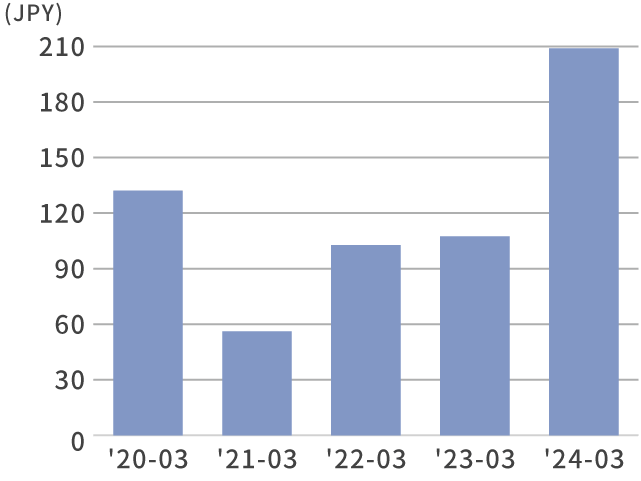
Net Income per Share
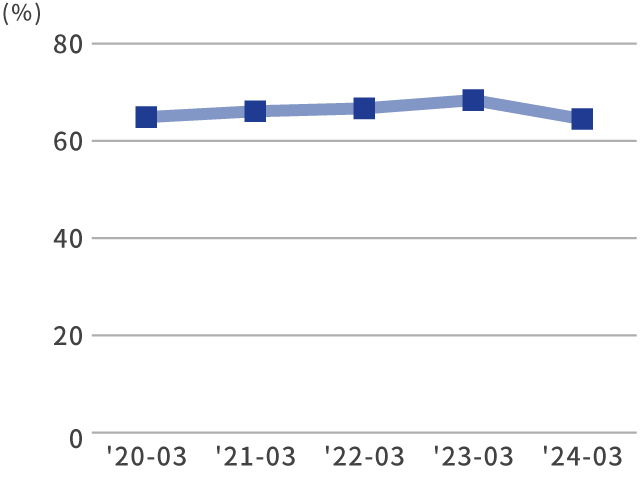
Equity Ratio
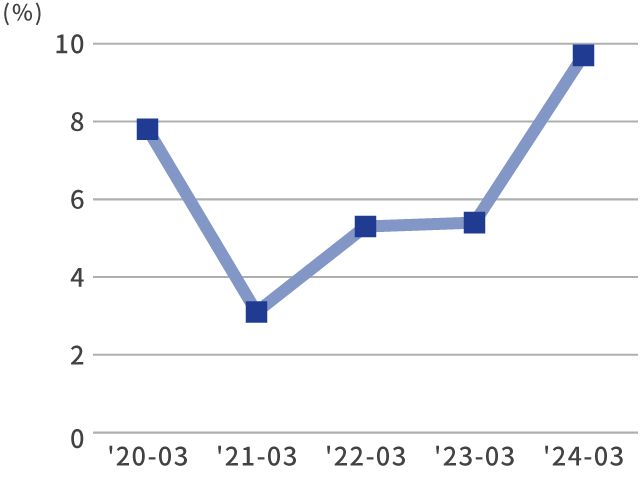
ROE
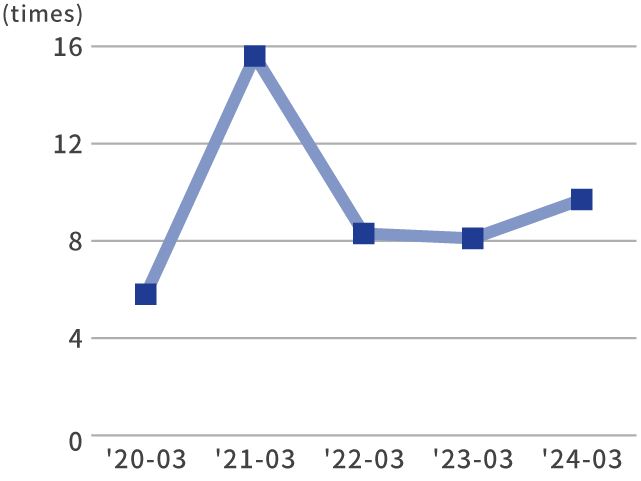
PER
| 2021-03 | 2022-03 | 2023-03 | 2024-03 | 2025-03 | ||
|---|---|---|---|---|---|---|
| Revenues | (million JPY ) | 54,871 | 56,905 | 61,030 | 73,688 | 84,190 |
| Ordinary Income | (million JPY ) | 2,128 | 3,385 | 3,557 | 6,374 | 9,935 |
| Net Income Attributable to Owners of The Parent |
(million JPY ) | 1,234 | 2,237 | 2,339 | 4,506 | 7,256 |
| Comprehensive Income | (million JPY ) | 3,899 | 1,719 | 1,695 | 7,594 | 5,496 |
| Total Equity | (million JPY ) | 41,282 | 42,462 | 43,375 | 49,186 | 52,948 |
| Total Assets | (million JPY ) | 62,443 | 63,698 | 63,457 | 76,228 | 80,163 |
| Book Value per Share | (JPY ) | 1,896.12 | 1,950.36 | 1,992.31 | 2,337.72 | 2,516.40 |
| Net Income per Share | (JPY ) | 56.11 | 102.76 | 107.43 | 209.44 | 344.90 |
| Equity Ratio | (%) | 66.1 | 66.7 | 68.4 | 64.5 | 66.0 |
| ROE | (%) | 3.1 | 5.3 | 5.4 | 9.7 | 14.2 |
| PER | (times) | 15.6 | 8.3 | 8.1 | 9.7 | 7.6 |
| Cash Flow from Operating Activities |
(million JPY ) | 1,136 | 904 | -157 | -1,453 | 4,651 |
| Cash Flow from Investing Activities |
(million JPY ) | -1,295 | -130 | -625 | -340 | -159 |
| Cash Flow from Financing Activities | (million JPY ) | -1,113 | -565 | -883 | -1,723 | -1,790 |
| Balance of Cash and Cash Equivalents at End of Year |
(million JPY ) | 13,686 | 13,968 | 12,340 | 8,847 | 11,533 |
| Number of employees | 848 | 870 | 901 | 899 | 940 | |
2023 Report
Consolidated Financial Statements for the Year Ended March 31, 2023, and Independent Auditor's ReportReportable Segments Orders Received